
So you want to run Inference on Kubernetes?
Since AI workloads took over the scene one area I have been keen on exploring is how this translates on the infrastructure more specifically how does one run say an LLM on Kubernetes.
I am hoping to make this a series but in this blog I intend to cover the basics of getting an inference engine set up on Kubernetes, how to serve a model as well as some other findings I have come across.
How are inference workloads different from standard applications?
Before diving into implementation I think a fair question to ask is how this differs from a regular application.
Inference as it relates to machine learning is the process of a trained model responding to questions or making predictions based on what it learned during the training phase.
But before inference can occur there are three distinct phases that need to happen before an inference application can respond to your request.
1. Tokenization
Your prompt is split into tokens which are numerical representations often called (input IDs) of your prompt before they are fed into the model.
2. Prefill
From here on out the inputs are run through each layer of the model in a single forward pass. If none of that made sense, you are not alone.
Transformer-based models i.e. LLMs all contain “layers”.
A forward pass is one trip through the entirety of a model’s layers. As an example, Qwen3-4B has 36 layers; one forward pass would equal a token’s vector going through layer 1, then 2, then 3 then 36, in order, with each layer’s output feeding the next.
During prefill every prompt token makes that trip at the same time, side by side, which is why it’s a single forward pass no matter how long the prompt is.
The prefill stage is also responsible for building the KV cache you may have heard about against your will. I am trying to keep scope tight but see links at the end for more info on KV Cache and why it is needed.
3. Decode
While each forward pass in the prefill stage can be executed in parallel, decode is responsible for producing tokens, this is interesting because each successive token produced is dependent on the previous one.
This is also why this step cannot be parallelized. As each token has a cyclic dependency on the previous token.
With this in mind, I hope the differences between an inference workload and a standard application that accepts requests over HTTPS are slightly more clear.
Thus far I have covered to a certain extent how an LLM works when you pass in a prompt. But where does an inference engine tie into all of this?
Where does an inference engine fit in?
Thus far, we have looked at what happens when a model receives a prompt. Something still needs to load the model, manage its memory and schedule requests as they arrive.
This is where an inference engine like vLLM comes in.
Originally I had planned to do a deep dive into inference engines, but I think that would be better suited to a standalone post (and the internals are frying the context window that is my brain).
For now, we will use vLLM to load a model and expose an API we can send requests to.
Cluster setup
For this demo I wanted to explore what it takes to run a model on Kubernetes. Sadly I am not made of money, and thanks to Mr Altman and friends, GPUs are expensive.
So I will be running a cluster on Civo without any GPUs. Thankfully, vLLM supports serving models on CPUs.
I am using one g4c.kube.medium worker in nyc1, with 16 vCPUs and 32 GiB of RAM. That gives room to experiment with a small model.
Running kubectl get nodes on my cluster yielded:
NAME                                                 STATUS   ROLES    AGE   VERSION        INTERNAL-IP   EXTERNAL-IP     OS-IMAGE             KERNEL-VERSION   CONTAINER-RUNTIME
k3s-inference-lab-6830-bd353f-node-pool-2884-rbdcu   Ready    <none>   15m   v1.35.0+k3s1   192.168.1.3   212.2.245.211   Alpine Linux v3.22   6.12.85-0-lts    containerd://2.1.5-k3s1
Checking the CPU
Before installing vLLM, I checked which CPU instructions were available inside a pod. This is because inference libraries use specialised instructions for numerical operations. Containers use the node’s CPU, and virtual machines may expose only some of the host’s capabilities.
Run a temporary pod:
kubectl run cpu-check \
  --image=busybox:1.37.0 \
  --restart=Never \
  --command -- sh -c \
  'uname -m; head -n 30 /proc/cpuinfo'

kubectl wait \
  --for=jsonpath='{.status.phase}'=Succeeded \
  pod/cpu-check --timeout=120s

kubectl logs cpu-check
kubectl delete pod cpu-check
If you had SSH access to the worker node a simple
uname -m; head -n 30 /proc/cpuinfo
would tell you what flags the CPU was compiled with. The interesting bit is:
CPU flags
flags          : fpu vme de pse tsc msr pae mce cx8 apic sep mtrr pge mca cmov
  pat pse36 clflush mmx fxsr sse sse2 ss ht syscall nx pdpe1gb rdtscp lm
  constant_tsc rep_good nopl xtopology cpuid tsc_known_freq pni pclmulqdq ssse3
  fma cx16 pcid sse4_1 sse4_2 x2apic movbe popcnt tsc_deadline_timer aes xsave avx
  f16c rdrand hypervisor lahf_lm abm 3dnowprefetch cpuid_fault ssbd ibrs ibpb
  stibp ibrs_enhanced fsgsbase tsc_adjust bmi1 avx2 smep bmi2 erms invpcid mpx
  avx512f avx512dq rdseed adx smap clflushopt clwb avx512cd avx512bw avx512vl
  xsaveopt xsavec xgetbv1 xsaves arat umip pku ospke avx512_vnni md_clear
  arch_capabilities
  bugs            : spectre_v1 spectre_v2 spec_store_bypass swapgs mmio_stale_data
  retbleed eibrs_pbrsb bhi ibpb_no_ret its
For my worker node, the exposed avx512f flag matches vLLM’s recommended x86 CPU requirement. The worker does not expose avx512_bf16, so I will start with float32.
Choosing a model
When choosing a model I went with the last model I read about, in this case Qwen3-0.6B, it’s popular enough to make for a challenge. Although I considered one of the GLM flash models.
Another consideration to make when selecting nodes as well as models is estimating how much memory to give the pods.
Taking Qwen3-0.6B for example, at four bytes per parameter, 600 million float32 parameters would take roughly 2.4 GB for the weights alone.
This is not factoring in KV cache and vLLM.
Downloading the model before starting vLLM
A useful pattern to adopt is to avoid downloading models over and over. While the version of Qwen I am running is only about 1.5 GB, newer models such as kimi-k3 are 1.56 TB in size.
So if I added another node to this cluster, and wanted to use another inference engine to serve the same model it would be useful to have it use the cached model.
Using an init container and a bit of Python this can be achieved:
from pathlib import Path
from huggingface_hub import snapshot_download

revision = "c1899de289a04d12100db370d81485cdf75e47ca"
target = Path("/models/qwen3-0.6b") / revision
marker = target / ".download-complete"

if marker.exists():
    print(f"Reusing complete model revision {revision} at {target}")
else:
    print(f"Downloading Qwen/Qwen3-0.6B revision {revision}")
    snapshot_download(
        repo_id="Qwen/Qwen3-0.6B",
        revision=revision,
        local_dir=str(target),
        allow_patterns=[
            "*.json", "*.safetensors", "*.txt",
            "*.model", "*.jinja", "*.tiktoken",
        ],
    )
    marker.write_text(revision + "\n")
    print(f"Model download complete: {target}")
snapshot_download retrieves the model weights, configuration and tokenizer files. revision pins the repository commit, while allow_patterns limits which files we fetch. Hugging Face download documentation
If the pod is replaced, the new init container mounts the same volume. When it finds that marker, it skips the download. If the original download failed halfway through, the marker will not exist and the script will try again.
Because the path /models will need to exist on the worker node, I have included the following persistent volume claim
apiVersion: v1
kind: PersistentVolumeClaim
metadata:
  name: model-cache
  namespace: inference
spec:
  accessModes:
    - ReadWriteOnce
  storageClassName: civo-volume
  resources:
    requests:
      storage: 30Gi
vLLM only needs to read the completed model, which is why its mount has readOnly: true.
env:
  - name: HF_HUB_OFFLINE
    value: "1"
This tells the Hugging Face libraries to use local files rather than reaching out to the Hub. It applies to the serving container; the init container still needs network access for the first download.
Here’s a small visualization on what download times could look like as file size grows based on the speeds from my provider.
Configuring vLLM
In the deployment the primary command for starting vLLM is vllm serve, to which you pass a couple of arguments, most of which are straightforward, so I would focus on the more confusing ones.
--dtype float32 selects 32-bit floating-point precision. It uses twice as much memory per weight as bfloat16. Here’s a good guide I found on floating point precision
--max-model-len sets the per-request context length.
--max-num-seqs 2 sets a cap on active concurrent sequences or requests evaluated in a single inference step.
Per the docs --enforce-eager:
If True, we will disable CUDA graph and always execute the model in eager mode. If False, we will use CUDA graph and eager execution in hybrid for maximal performance and flexibility.
Seeing as we have no GPU, it’s best it’s left disabled.
On the CPU side of things, 3 environment variables can be used to define KV cache size and OpenMP threads:
env:
  - name: VLLM_CPU_KVCACHE_SPACE
    value: "2"
  - name: VLLM_CPU_OMP_THREADS_BIND
    value: nobind
  - name: OMP_NUM_THREADS
    value: "12"
These allocate 2 GiB for the KV cache and configure 12 OpenMP threads. nobind prevents assigning those threads to specific CPU IDs.
Note on cold starts
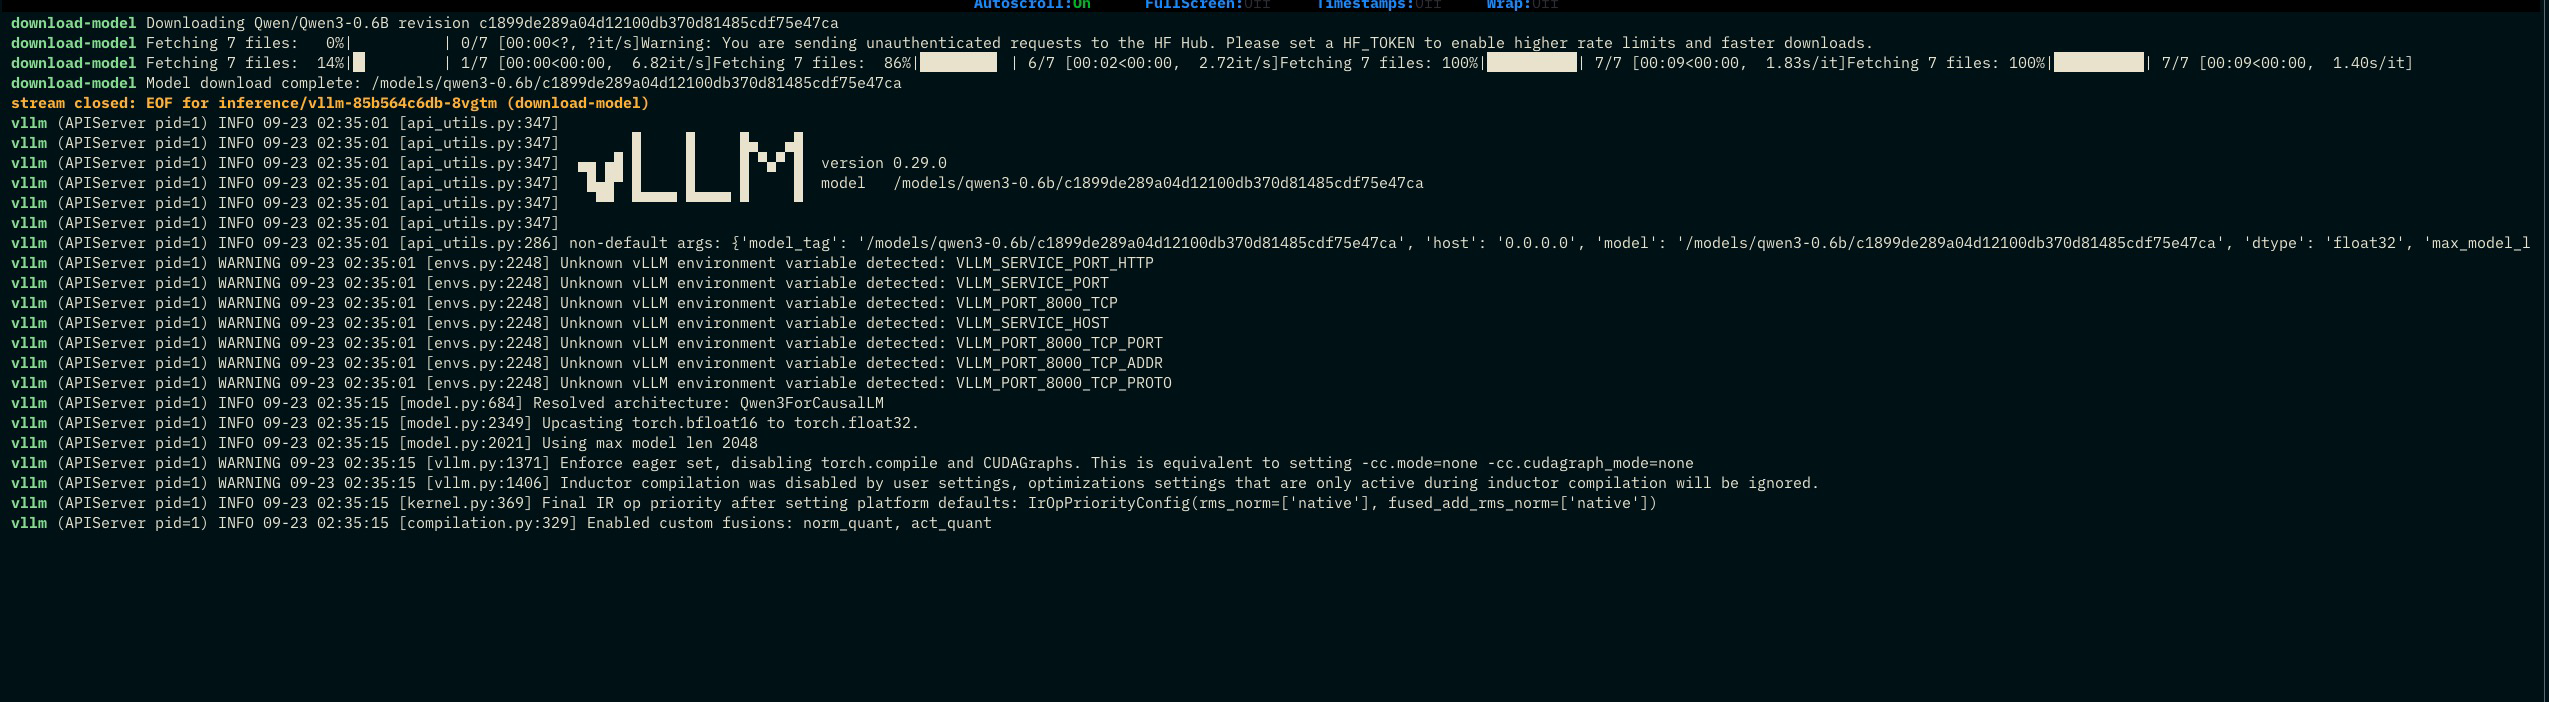
Starting the container does not mean the model is ready to answer requests. vLLM still needs to load the weights and initialize the engine.
Our startup probe allows roughly 20 minutes for /health to succeed after the serving container starts. This excludes time spent pulling the image or running the download init container.
The readiness probe checks the same endpoint before the Service sends traffic to the pod.
Bringing it all together
I thought it best to discuss individual portions of the manifest before actually applying anything. From here on out it is relatively straightforward
kubectl --context inference-lab apply -f vllm/inference.yaml
Watch the pods come up:
kubectl --context inference-lab -n inference get pods -w
NAME                    READY   STATUS    RESTARTS   AGE
vllm-85b564c6db-8vgtm   0/1     Pending   0          9s
Wait for readiness:
kubectl --context inference-lab -n inference \
  rollout status deployment/vllm --timeout=30m
Forward the Service to your machine:
kubectl --context inference-lab -n inference \
  port-forward service/vllm 8000:8000
curl -fsS http://localhost:8000/v1/models | jq
Model listing response
{
  "object": "list",
  "data": [
    {
      "id": "qwen3-0.6b",
      "object": "model",
      "created": 1790132721,
      "owned_by": "vllm",
      "root": "/models/qwen3-0.6b/c1899de289a04d12100db370d81485cdf75e47ca",
      "parent": null,
      "max_model_len": 2048,
      "permission": [
        {
          "id": "modelperm-becda07964d801a3",
          "object": "model_permission",
          "created": 1790132721,
          "allow_create_engine": false,
          "allow_sampling": true,
          "allow_logprobs": true,
          "allow_search_indices": false,
          "allow_view": true,
          "allow_fine_tuning": false,
          "organization": "*",
          "group": null,
          "is_blocking": false
        }
      ]
    }
  ]
}
Now to ask important questions.
curl --fail-with-body -sS \
    http://localhost:8000/v1/chat/completions \
    -H 'Content-Type: application/json' \
    --data-binary @- <<'JSON' | jq -r '.choices[0].message.content'
  {
    "model": "qwen3-0.6b",
    "messages": [
      {"role": "user", "content": "Explain a Kubernetes pod in two sentences."}
    ],
    "temperature": 0,
    "max_tokens": 128,
    "stream": false,
    "chat_template_kwargs": {"enable_thinking": false}
  }
JSON
output. A Kubernetes pod is a container that runs a set of applications in a single node of a Kubernetes cluster, providing a lightweight and isolated environment for the application.
What about those “Agent Gateways”
At this point I have a working model deployed, a way to reach it and I could in theory slap on an ingress and call it a day.
However I have already gone through this much to deploy a model so I might as well take it all the way.
Agent gateways can be thought about as a “model-aware” layer on top of the existing Kubernetes gateway API spec. Agentgateway seems to be most popular at the time of writing, it is built in Rust and supports the A2A protocol as well as MCP so that is what I would be going with.
Deploying Agentgateway provides ample opportunity to do two things:
- Rate limit
- Scrape metrics
Rate-limiting becomes important as you scale and metrics can inform you about the model’s performance.
Installing Agentgateway
To begin, install the Gateway API CRDs on the existing cluster:
kubectl --context inference-lab apply --server-side \
  -f https://github.com/kubernetes-sigs/gateway-api/releases/download/v1.6.0/standard-install.yaml
Then install Agentgateway controller and CRDs using Helm:
helm upgrade --install agentgateway-crds \
    oci://cr.agentgateway.dev/charts/agentgateway-crds \
    --version v1.5.0 \
    --kube-context inference-lab \
    --namespace agentgateway-system \
    --create-namespace \
    --wait

helm upgrade --install agentgateway \
    oci://cr.agentgateway.dev/charts/agentgateway \
    --version v1.5.0 \
    --kube-context inference-lab \
    --namespace agentgateway-system \
    --wait
Linking Agentgateway to vLLM
There are a few more CRDs to be applied before Agentgateway can route requests to vLLM, here’s a high-level diagram:
flowchart TD
  Client["Client"]

  subgraph Gateway["Gateway"]
      Listener["HTTP listener :8080"]
  end

  Route["HTTPRoute"]
  Backend["AgentgatewayBackend"]
  Service["vLLM Service :8000"]
  Pod["vLLM Pod · Qwen3"]

  Client --> Listener
  Listener --> Route
  Route --> Backend
  Backend --> Service
  Service --> Pod

  Policy["Rate-limit policy"]
Policy -. applies to .-> Route 1. Create the gateway
As shown in the diagram the gateway serves as the entry point for different clients.
The AgentgatewayParameters resource customizes the proxy deployment and its Service. Its metadata.namespace places it in agentgateway-system, alongside the Gateway. These settings give us one proxy replica and an internal Service:
spec:
  deployment:
    spec:
      replicas: 1
  service:
    spec:
      type: ClusterIP
The same file contains the Gateway, which references these parameters and defines an HTTP listener on port 8080. Its allowedRoutes.namespaces.from: Same setting allows routes from the Gateway’s namespace to attach.
kubectl --context inference-lab apply -f agentgateway/agentgateway.yaml
2. Define the model backend
The backend in this example points to the vLLM Service we already created:
provider:
  openai:
    model: qwen3-0.6b
  host: vllm.inference.svc.cluster.local
  port: 8000
openai selects the API format that vLLM implements. The request still goes to our own model. The model name matches --served-model-name in the vLLM deployment, and the hostname identifies the vllm Service in the inference namespace.
kubectl --context inference-lab apply -f agentgateway/agentgateway-backend.yaml
3. Connect the listener to the backend
The HTTPRoute attaches to the gateway’s http listener and matches POST /v1/chat/completions. Matching requests go to the qwen AgentgatewayBackend.
kubectl --context inference-lab apply -f agentgateway/agentgateway-route.yaml
4. Apply a rate limit
The AgentgatewayPolicy targets our qwen route. For the demo, I am starting with a small limit so we can see requests being rejected:
traffic:
  rateLimit:
    local:
      - requests: 2
        unit: Minutes
        burst: 0
This configures two requests per minute with no additional burst allowance. Requests that exceed the available allowance receive HTTP 429.
kubectl --context inference-lab apply -f agentgateway/agentgateway-rate-limit.yaml
Once again I can expose this locally, through a port-forward:
kubectl --context inference-lab -n agentgateway-system \
    port-forward service/inference-gateway 8080:8080
And send a request:
curl --fail-with-body -sS \
    http://localhost:8080/v1/chat/completions \
    -H 'Content-Type: application/json' \
    --data-binary @- <<'JSON' | jq
  {
    "model": "qwen3-0.6b",
    "messages": [
      {"role": "user", "content": "Explain a Kubernetes pod in two sentences."}
    ],
    "temperature": 0,
    "max_tokens": 128,
    "stream": false,
    "chat_template_kwargs": {"enable_thinking": false}
  }
JSON
The response should look like this:
Gateway response
{
  "model": "qwen3-0.6b",
  "usage": {
    "prompt_tokens": 21,
    "completion_tokens": 32,
    "total_tokens": 53
  },
  "choices": [
    {
      "message": {
        "content": "A Kubernetes pod is a container that runs a set of applications in a single node of a Kubernetes cluster, providing a lightweight and isolated environment for the application.",
        "role": "assistant",
        "refusal": null,
        "annotations": null,
        "audio": null,
        "function_call": null,
        "reasoning": null
      },
      "index": 0,
      "logprobs": null,
      "finish_reason": "stop",
      "stop_reason": null,
      "token_ids": null,
      "routed_experts": null
    }
  ]
}
Sending more than two requests within a minute yields an HTTP 429.
Measuring performance
This is great and all but as I mentioned I would love to get some metrics out of this so, I need Prometheus to scrape metrics from agentgateway.
In particular I am most interested in agentgateway_gen_ai_client_token_usage_sum, which accumulates input and output token counts, and agentgateway_request_duration_seconds_sum, which accumulates request durations. Applying rate() to the token counter gives tokens per second; multiplying by 60 gives tokens per minute.
First, expose the gateway’s metrics port through an internal Service. Then deploy Prometheus using the companion manifests. Run these commands from the companion repository’s root directory:
kubectl --context inference-lab apply -f monitoring/agentgateway-metrics-service.yaml
kubectl --context inference-lab apply -f monitoring/prometheus.yaml
The scrape configuration uses cluster DNS names:
scrape_configs:
  - job_name: agentgateway
    static_configs:
      - targets:
          - inference-gateway-metrics.agentgateway-system.svc.cluster.local:15020
  - job_name: vllm
    static_configs:
      - targets:
          - vllm.inference.svc.cluster.local:8000
Wait for Prometheus, then forward its web interface:
kubectl --context inference-lab -n monitoring \
  rollout status deployment/prometheus --timeout=5m
kubectl --context inference-lab -n monitoring \
  port-forward service/prometheus 9090:9090
Running the following query yields:
round(
  sum by (gen_ai_token_type) (
    rate(agentgateway_gen_ai_client_token_usage_sum{job="agentgateway"}[15m])
  ) * 60,
  0.1
)
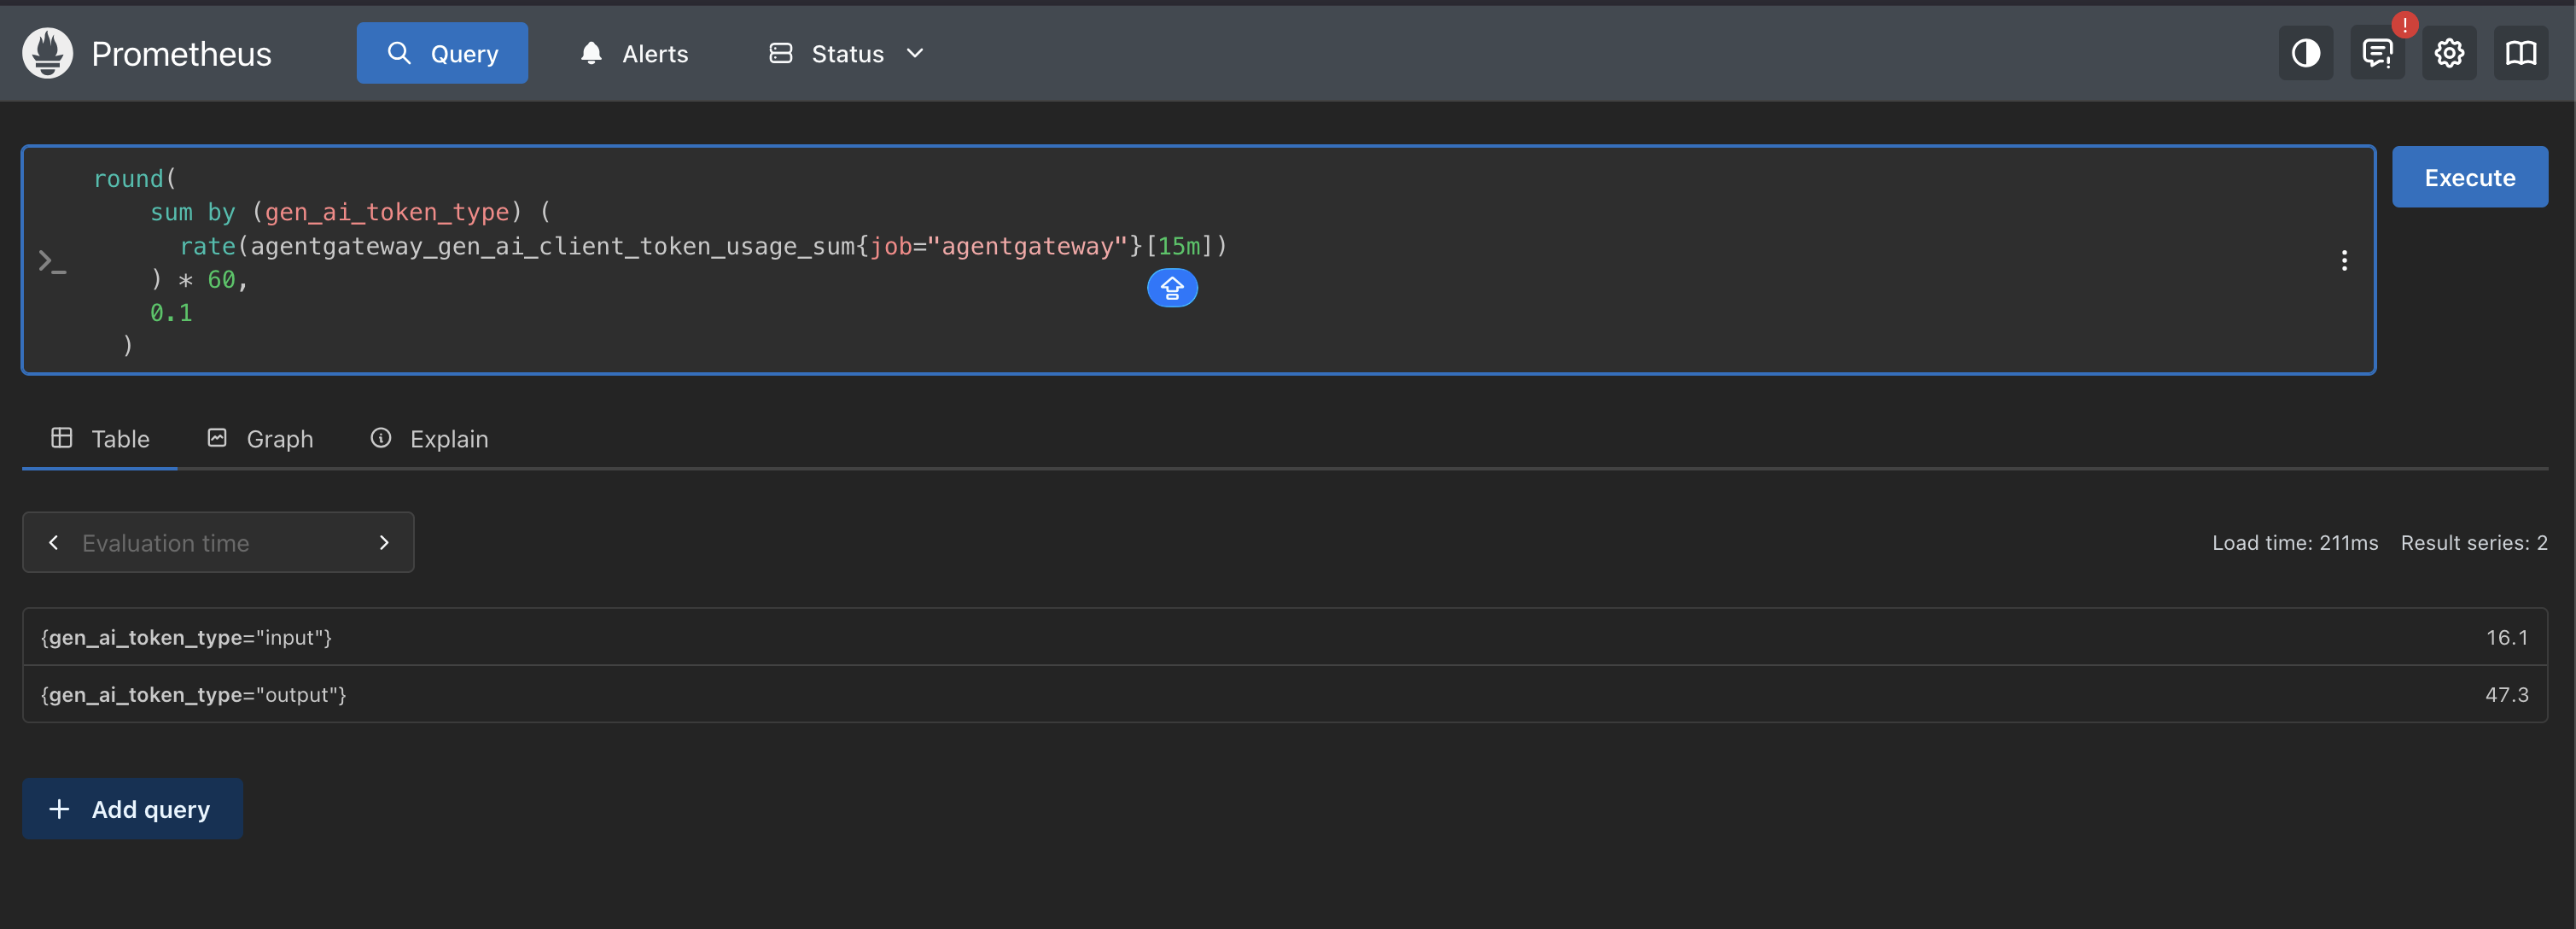
The screenshot shows 16.1 input tokens and 47.3 output tokens per minute, averaged over 15 minutes. With only occasional requests and a two-requests-per-minute limit, this measures the traffic I sent rather than the CPU deployment’s maximum throughput.
Benchmarking against a cluster with a GPU
Remember how I said I was GPU poor? Well, toward the tail end of this blog, a good friend was kind enough to share some capacity with me. This was a good opportunity to see how much of a difference running inference on a GPU cluster makes.
Recall that the earlier screenshot showed 16.1 input tokens and 47.3 output tokens per minute. That works out to about 0.27 input tokens/s and 0.79 output tokens/s.
For this comparison, I ran the same workload against both clusters through Agentgateway, using a separate route without that rate limit.
Setting up the GPU deployment
The new cluster runs on Nebius and has one NVIDIA H100 with 80 GB of GPU memory. From here on, the steps are the same as before.
-
The NVIDIA device plugin was already installed. The node advertised one
nvidia.com/gpuresource, so I could request it in the pod. I would love to explain the plugin here, but I already covered it in my blog on GPU time-slicing. Check it out! This run uses one GPU with no time-slicing configured. -
Switched the image and precision. I used the CUDA build,
vllm/vllm-openai:v0.29.0, and--dtype bfloat16, instead of the CPU build andfloat32. The Qwen3-0.6B model revision stayed the same. The companion manifest pins the GPU image by digest. -
The pod requests a GPU. I added
nvidia.com/gpu: "1"to its resource requests and limits, set--gpu-memory-utilization 0.25, and removed the CPU-specific KV-cache and OpenMP environment variables.
I kept --max-model-len 2048, --max-num-seqs 2, and --enforce-eager for both deployments, along with the same 12-CPU request, 14-CPU limit, 12 GiB memory request, and 20 GiB memory limit. This compares the two working deployments, including their precision and platform differences; it is not a hardware-only comparison or a claim about the H100’s maximum throughput.
Sending the same workload to both clusters
I used two concurrent clients, temperature 0, and 128 output tokens per request with ignore_eos: true. Thinking was disabled, and each request had a distinct numbered prompt. Each run started with two warm-up requests, followed by 120 seconds of requests and enough time for the last in-flight requests to finish. Model download, loading, and warm-up were outside the timed window.
The benchmark client runs inside the vLLM pod and sends requests to the gateway’s cluster Service, keeping my laptop’s network out of the timings. benchmark/run.py records each response’s token usage, latency, and completion time.
Run three trials on each cluster from the companion directory:
mkdir -p results
for trial in 1 2 3; do
  kubectl --context inference-lab -n inference exec -i deployment/vllm \
    -- env BENCHMARK_LABEL=cpu python3 - \
    < benchmark/run.py > "results/cpu-${trial}.json"

  kubectl --context nebius-inference-benchmark -n inference exec -i deployment/vllm \
    -- env BENCHMARK_LABEL=gpu python3 - \
    < benchmark/run.py > "results/gpu-${trial}.json"
done
Comparing token throughput
The most obvious indicator of performance is token throughput. Across the runs I did, the median results were:
| Deployment | Input tokens/s | Output tokens/s |
|---|---|---|
| Civo CPU, Intel Xeon Cascade Lake, FP32 | 10.90 | 31.00 |
| Nebius, one H100 80 GB, BF16 | 66.34 | 188.70 |
For this workload, the GPU deployment delivered 6.09 times the output throughput. All six runs completed without request errors. These are aggregate rates across two clients, calculated as completed-request tokens divided by the full measured wall time, including the final request drain.
sum by (gen_ai_token_type) (
  rate(agentgateway_gen_ai_client_token_usage_sum{job="agentgateway"}[1m])
)
What was all this for?
Spinning up an inference engine and getting an understanding of what the infra that powers the tooling I use every day has been in the back of my mind for a while.
Research for this post has only shown me how much more there is to know, in the coming months I will likely make this a series so keep an eye out.
Thanks to @Rassh_RAJ for reviewing my early drafts.
If you’d like to chat about this drop me a line, my email is somewhere on this website.
And if you need code snippets, the repo is over here.
Until next time :)